I was recently talking to a founder friend about a classic startup headache: How do you take messy Salesforce leads and turn them into a predictable future budget?
The usual playbook is to throw a standard time-series model or an XGBoost algorithm at monthly totals, hoping the algorithm will sort out the noise. But the reality is that B2B sales pipelines are simply too chaotic for one "magic bullet" model. There are too many moving parts, behavioral quirks, and unseen variables.
Instead of hunting for one perfect model to rule them all, we need to start thinking in terms of system boundaries and multi-layer frameworks.
In our latest dashboard development, we abandoned the monolithic approach entirely. Here is a breakdown of the architecture we built to handle this complexity:
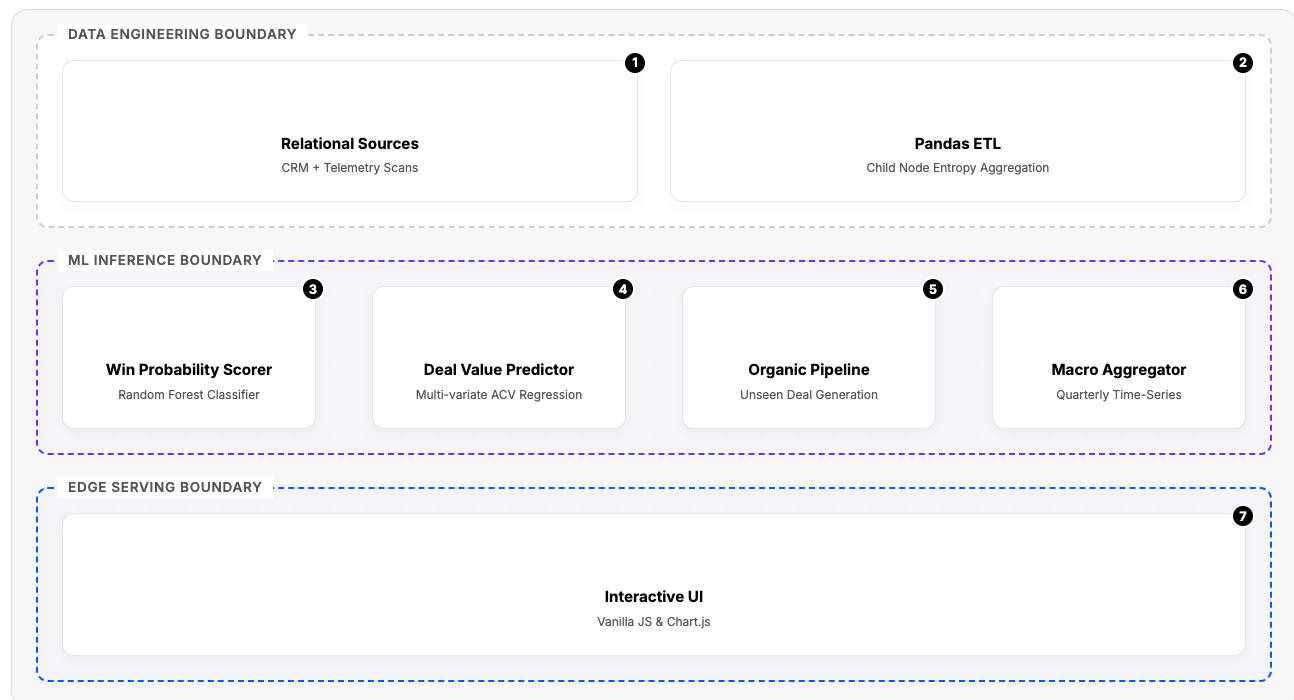
1. The Data Engineering Boundary
Before any predictions happen, you have to tame the chaos. We built this layer to handle data ingestion and preprocessing.
- Relational Sources: We pull raw data directly from CRM systems and combine it with active telemetry scans.
- Pandas ETL: We process this raw feed using Pandas to perform what we call Child Node Entropy Aggregation—cleaning, structuring, and preparing the complex relational data for the models downstream.
2. The ML Inference Boundary
This is where the magic happens. Instead of one model trying to predict the final revenue number, we broke the problem down into a multi-stage framework:
- Win Probability Scorer: We use a Random Forest Classifier to evaluate individual deals and score the sheer probability of winning them.
- Deal Value Predictor: A secondary Multi-variate ACV Regression model estimates the actual contract value of those deals. (This creates our "two-stage hurdle model"—first, will we win it? Second, what is it worth?)
- Organic Pipeline: We model "unseen" deal generation using a cohort-driven approach, predicting future pipeline creation before it even exists in the CRM.
- Macro Aggregator: Finally, a Quarterly Time-Series aggregator rolls all of these individual micro-predictions into a cohesive macroeconomic forecast.
3. The Edge Serving Boundary
Data is only as good as the decisions it drives. We didn't want this locked in a Jupyter notebook, so we built an Interactive UI powered by Vanilla JS and Chart.js to serve these insights directly to the edge.
The Result
Leadership can finally allocate budgets based on machine-generated, probabilistically sound forecasts rather than human optimism and "gut feel."
By breaking the problem down into a pipeline of specialized models, we achieved a level of accuracy and interpretability that a single algorithm could never reach.